본 게시글의 원문은 Yann Debray의 MATLAB with Python Book 입니다. 해당 책은 MIT 라이센스를 따르기 때문에 개인적으로 번역하여 재배포 합니다. 본 포스팅에는 추후 유료 수익을 위한 광고가 부착될 수도 있습니다.
MIT License

Copyright (c) 2023 Yann Debray

Permission is hereby granted, free of charge, to any person obtaining a copy
of this software and associated documentation files (the "Software"), to deal
in the Software without restriction, including without limitation the rights
to use, copy, modify, merge, publish, distribute, sublicense, and/or sell
copies of the Software, and to permit persons to whom the Software is
furnished to do so, subject to the following conditions:

The above copyright notice and this permission notice shall be included in all
copies or substantial portions of the Software.

THE SOFTWARE IS PROVIDED "AS IS", WITHOUT WARRANTY OF ANY KIND, EXPRESS OR
IMPLIED, INCLUDING BUT NOT LIMITED TO THE WARRANTIES OF MERCHANTABILITY,
FITNESS FOR A PARTICULAR PURPOSE AND NONINFRINGEMENT. IN NO EVENT SHALL THE
AUTHORS OR COPYRIGHT HOLDERS BE LIABLE FOR ANY CLAIM, DAMAGES OR OTHER
LIABILITY, WHETHER IN AN ACTION OF CONTRACT, TORT OR OTHERWISE, ARISING FROM,
OUT OF OR IN CONNECTION WITH THE SOFTWARE OR THE USE OR OTHER DEALINGS IN THE
SOFTWARE.
본 게시물에서 활용된 소스 코드들은 모두 Yann Debray의 GitHub Repo에서 확인할 수 있습니다.
4.5. MATLAB에서 Python 커뮤니티 패키지 호출하기
지구과학 및 기후 과학과 같은 일부 과학 분야에서는 Python 커뮤니티가 점점 커지고 있습니다. 하지만 연구원과 엔지니어들의 프로그래밍 능력은 매우 다양하기 때문에, MATLAB에서 Python 커뮤니티 패키지에 대한 인터페이스를 만들면 500만 이상의 MATLAB 커뮤니티에 특정 도메인의 능력을 제공할 수 있습니다.
이에 대한 좋은 예시 중 하나는 MathWorker인 Rob Purser가 개발한 Climate Data Store Toolbox입니다. Rob과 저는 MathWorks Open Source 프로그램 핵심 팀의 일원입니다. 우리는 오픈 소스를 홍보하며, MathWorks 제품에서 오픈 소스 소프트웨어 사용을 지원하고 MathWorkers가 GitHub와 MATLAB 파일 교환에 자신의 작업을 기여하는 데 도움을 주고 있습니다.
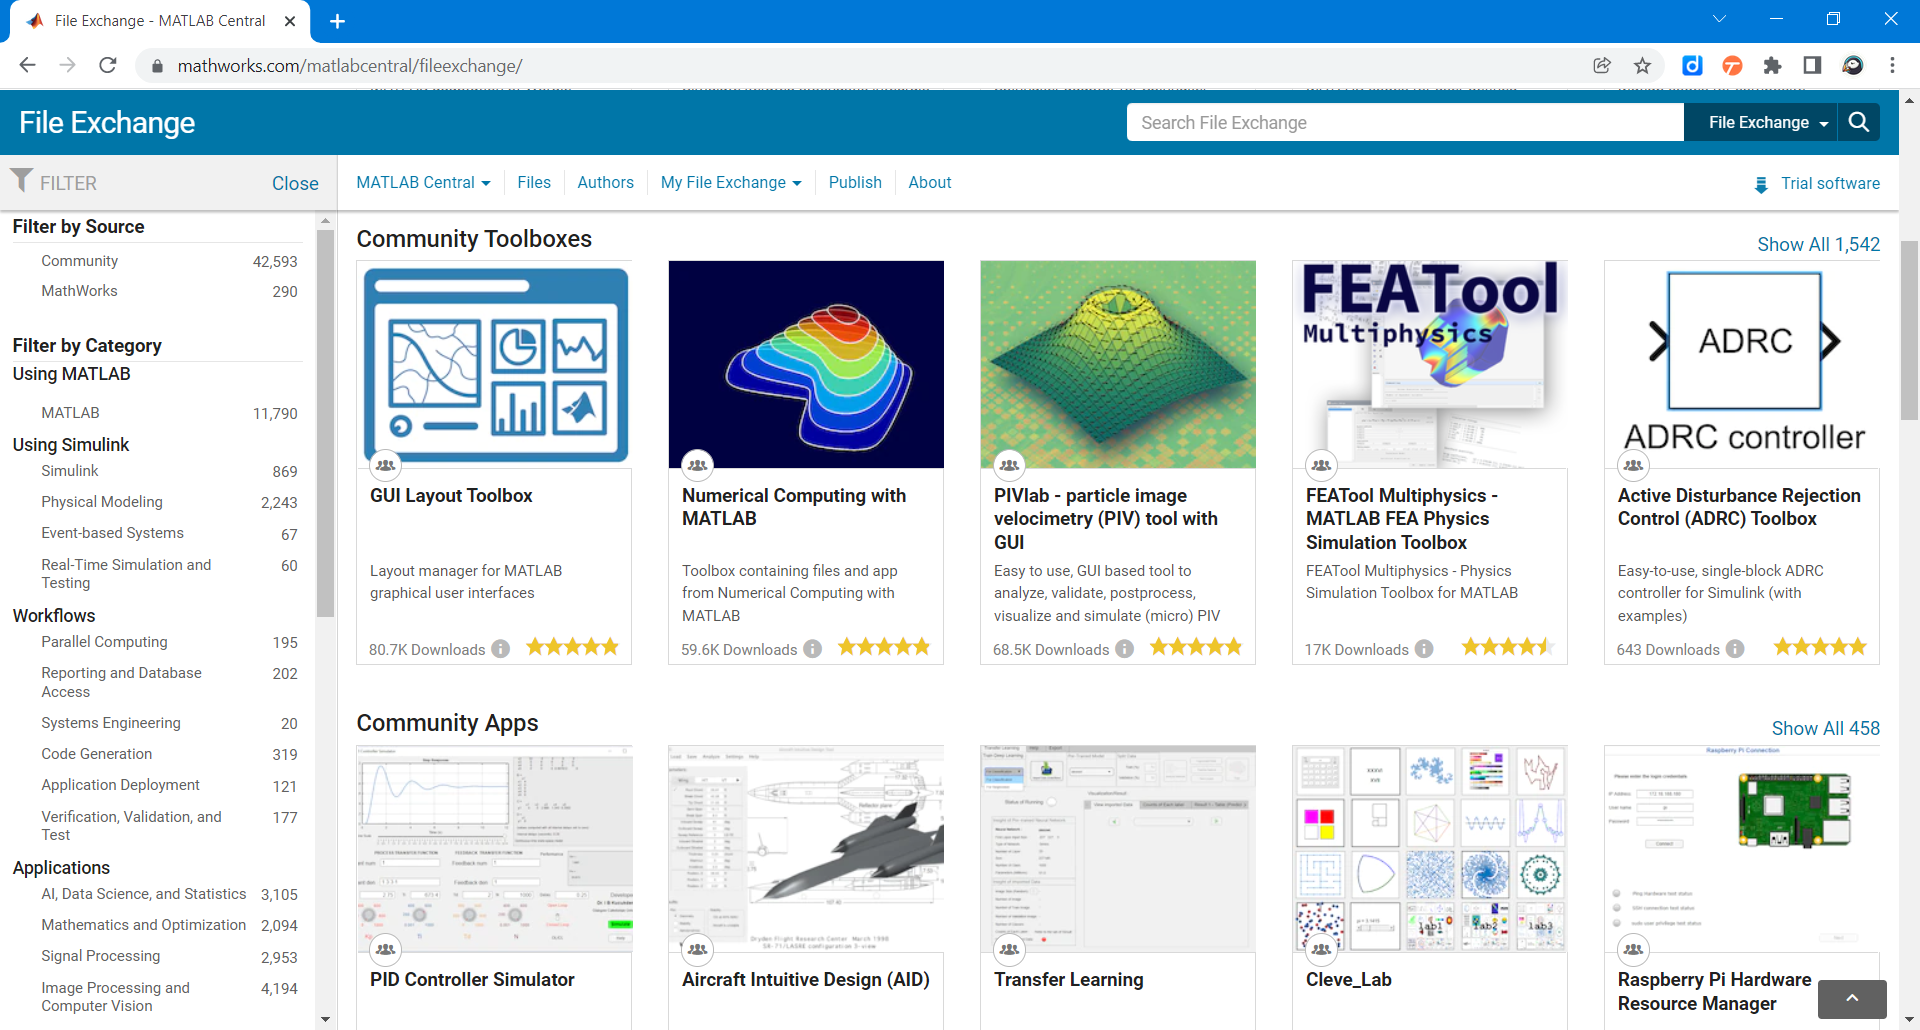
이 섹션에서는 Climate Data Store Toolbox를 사용하여 Python 패키지 위에 MATLAB 툴박스를 어떻게 구축하는지에 대해 설명합니다. 이 툴박스는 유럽 중기 기상 예보 센터 (ECMWF)가 만든 CDS Python API에 의존합니다. 이 툴박스는 자동으로 Python을 설정하고 CDSAPI 패키지를 다운로드하고 설치할 것입니다 (수동으로 pip install cdsapi를 사용하여 수동으로 설치할 수도 있습니다). 데이터를 검색하려면 https://cds.climate.copernicus.eu/에서 계정을 만들어야 합니다.
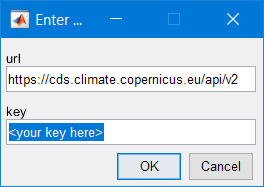
처음 사용할 때, CSAPI 자격 증명을 요청할 것입니다.
데이터 세트에서 다운로드할 데이터를 선택하십시오 (이 웹페이지에서 옵션 확인). 이것은 API 요청에서 생성되는 Python 구조의 “MATLAB화”된 버전입니다.
datasetName ="satellite-sea-ice-thickness";
options.version = "1_0";
options.variable = "all";
options.satellite = "cryosat_2";
options.cdr_type = ["cdr","icdr"];
options.year = ["2011","2021"];
options.month = "03";
[downloadedFilePaths,citation] = climateDataStoreDownload('satellite-sea-ice-thickness',options);
2021-12-03 14:45:47,502 INFO Welcome to the CDS
2021-12-03 14:45:47,504 INFO Sending request to https://cds.climate.copernicus.eu/api/v2/resources/satellite-sea-ice-thickness
2021-12-03 14:45:47,610 INFO Request is completed
2021-12-03 14:45:47,611 INFO Downloading https://download-0012.copernicus-climate.eu/cache-compute-0012/cache/data0/dataset-satellite-sea-ice-thickness-2e9e98de-6daf-4e4e-b54c-6e2d3717bda2.zip to C:\Users\rpurser\AppData\Local\Temp\tp047bab7e_df6a_405a_b357_cda6a03d28f6.zip (4.4M)
2021-12-03 14:45:50,037 INFO Download rate 1.8M/s
Python으로 가져온 NetCDF 파일은 ncread를 사용하여 MATLAB에서 읽고 timetable 형식으로 정보를 저장합니다. 이 작업은 readSatelliteSeaIceThickness 함수를 통해 수행됩니다.
ice2011 = readSatelliteSeaIceThickness("satellite-sea-ice-thickness\ice_thickness_nh_ease2-250_cdr-v1p0_201103.nc");
ice2021 = readSatelliteSeaIceThickness("satellite-sea-ice-thickness\ice_thickness_nh_ease2-250_icdr-v1p0_202103.nc");
head(ice2021)
| time | lat | lon | thickness | |
|---|---|---|---|---|
| 1 | 01-Mar-2021 | 47.6290 | 144.0296 | 2.4566 |
| 2 | 01-Mar-2021 | 47.9655 | 144.0990 | 2.5800 |
| 3 | 01-Mar-2021 | 50.5072 | 148.0122 | -0.0364 |
| 4 | 01-Mar-2021 | 50.8360 | 148.1187 | 1.0242 |
| 5 | 01-Mar-2021 | 50.3237 | 146.9969 | 0.0518 |
| 6 | 01-Mar-2021 | 51.1642 | 148.2269 | 0.2445 |
| 7 | 01-Mar-2021 | 50.9112 | 147.6573 | 0.8933 |
| 8 | 01-Mar-2021 | 50.6540 | 147.0948 | 0.1271 |
disp(citation)
Generated using Copernicus Climate Change Service information 2021
이 툴박스는 MATLAB의 아름다운 지리 데이터 시각화 기능을 활용합니다.
subplot(1,2,1)
geodensityplot(ice2011.lat,ice2011.lon,ice2011.thickness,"FaceColor","interp")
geolimits([23 85],[-181.4 16.4])
geobasemap("grayterrain")
title("Ice Thickness, March 2011")

subplot(1,2,2)
geodensityplot(ice2021.lat,ice2021.lon,ice2021.thickness,"FaceColor","interp")
geolimits([23 85],[-181.4 16.4])
geobasemap("grayterrain")
title("Ice Thickness, March 2021")
f = gcf;
f.Position(3) = f.Position(3)*2;

이처럼 잘 작성된 toolbox에서는 해당 toolbox와 직접 패키지화된 문서를 찾을 수 있습니다.
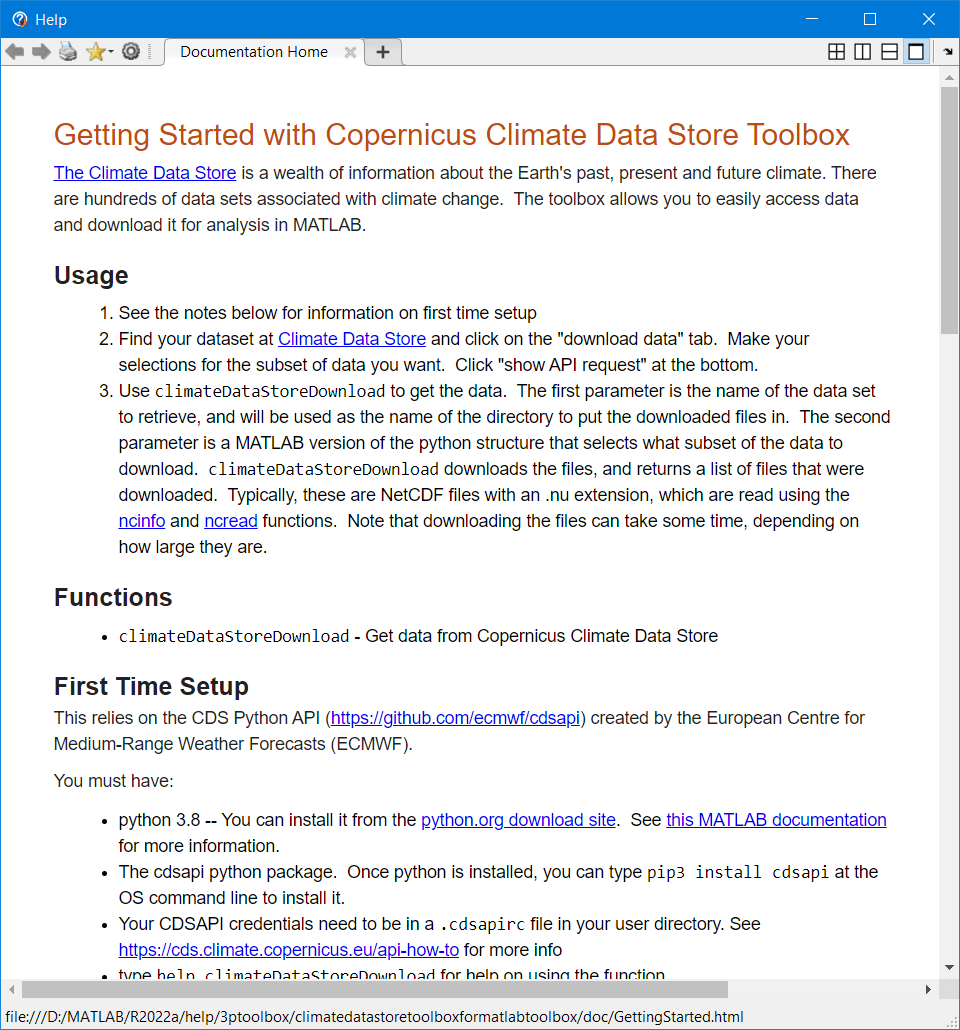
자신만의 toolbox를 생성하여 다른 사람과 공유할 수 있습니다. 이 파일들은 MATLAB 코드, 데이터, 앱, 예제 및 문서를 포함할 수 있습니다. 툴박스를 생성할 때 MATLAB은 당신이나 다른 사람이 툴박스를 설치할 수 있게 해주는 단일 설치 파일 (.mltbx)을 생성합니다.
툴박스 생성 및 공유 방법에 대해 더 읽어보세요.